How Right Sized Inventory’s Predictive Analytics Enhances MEIO
Key Take Aways:
Multi-echelon inventory optimization (MEIO) software solutions are used for complex supply-chain network design.
MEIO solutions typically seek to minimize inventory-related costs/investment and maximize gross profit. MEIO output also includes optimized economic order quantities (EOQs) and recommended target service levels.
While MEIO solutions also provide first-pass replenishment method inventory policy values, they do not incorporate the probabilistic confidence of achieving the target service level for a given timeframe.
Right Sized Inventory’s patented predictive analytics solution finishes the process by delivering a correct, probabilistic supply-chain simulation model for any stocked item in any location; thus, enhancing the MEIO’s first-pass inventory policy value(s).
MEIO is valuable for designing complex supply-chain networks. Right Sized Inventory predictive analytics doesn’t compete with nor replace MEIO because it is laser-focused on optimizing each item-location’s one or two replenishment inventory-policy parameters.
MEIO Example
Multi-echelon inventory optimization (MEIO) refers to the practice of managing inventory levels, including safety stock, across a supply chain system that includes multiple layers of suppliers and distribution centers. MEIO uses advanced mathematical algorithms to accurately model inventory flows through interdependent stages and locations of a supply chain.
Many software providers offer multi-echelon inventory optimization (MEIO) solutions for complex supply-chain network design. Though each has differences, MEIO typically involves one or more of these goals:
Minimize inventory-related costs
Minimize inventory investment
Maximize profitability (e.g., gross profit)
Optimize EOQs
Recommend target service levels
Many MEIOs also produce first-pass replenishment method inventory-policy values, e.g.:
ROP reorder point
Min and max
PAR
Kanban quantity per “bin” and number of “bins”
MRP safety stock adder to gross requirements
The buffer-inventory portion of these values
Why do we say "first-pass"? Because it’s not complete! Right Sized Inventory’s predictive analytics solution (shorthand RSI PA) finishes the process by delivering a correct, probabilistic supply-chain simulation model for any stocked item in any location; thus, enhancing the MEIO’s first-pass inventory policy value(s). How so? Let’s look at an MEIO model example.
Consider this MEIO model (see flow chart below), with:
Local and offshore suppliers
On-shore factory
Distribution center DC01
Regional DCs RDC01 and RDC02
Customer-facing outlets OUT01, OUT02, OUT03 and OUT04
Buy-to-stock saleable product SKU020P
Make-to-stock saleable product SKU010M
Buy-to-stock components for the “make” SKU, COMP001 and COMP002

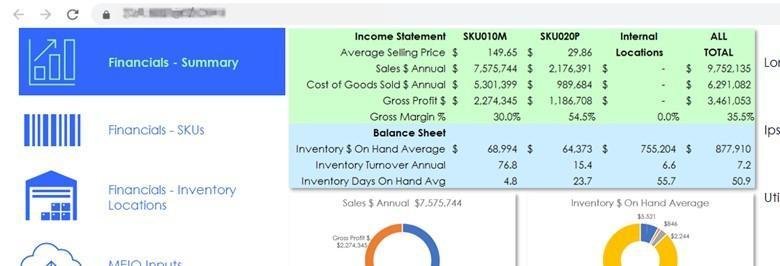
Let’s next review our example MEIO’s first-pass summary financial results (see Appendix A for this example MEIO’s inputs and calculations):
A deeper dive into how RSI predictive analytics enhances MEIO
For each item in each location, let’s see how RSI PA can enhance two key MEIO first-pass values:
Safety stock quantity
Reorder point
RSI PA shares certain MEIO inputs (white background below) and employs a critical MEIO output – EOQ (bold font, blue arrows, blue background below):

To simulate a supply chain correctly and completely, RSI PA requires inputs (green background above) not typically used in MEIO. RSI PA does not need MEIO inputs for inventory costs. Green arrows and bold font above highlight a distinguishing feature of predictive analytics: The probabilistic confidence of achieving the target service level (TSL) in a service-level cycle (SLC) – the period during which actual service level (ASL) is measured and compared to TSL. In this example, the SLC is one business quarter of 90 calendar days in which all demand and demand fulfilled on time are separately summed. ASL in a SLC is demand fulfilled on time divided by all demand.
In our example, RSI PA recommends the optimal, i.e., minimum, inventory position (such as safety stock quantity or reorder point) to support an 85% probability (about 5 quarters in 6) of achieving an item-location’s TSL in a one-quarter SLC – without expediting. Just as TSL is a strategic decision, so is target confidence.
Right Sized Inventory PA enhancements to MEIO first-pass results
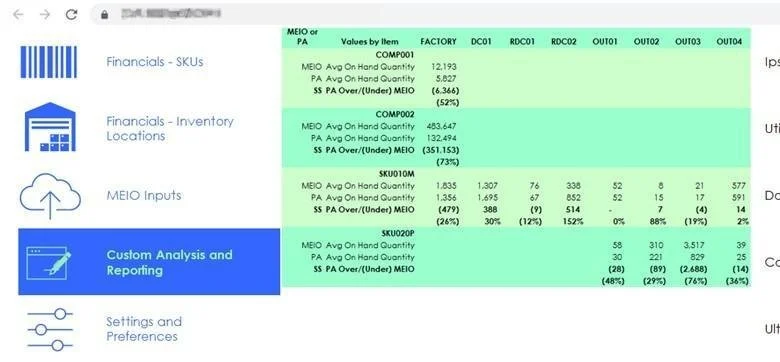
Consider three fundamental values followed by their effects on financial performance (see matrix below):
Safety stock quantity (SS) – For most item-locations, RSI PA’s enhanced SS is less than MEIO’s; the remaining item-locations are increases. Nearly all differences are substantial. NOTE: Various MEIO solutions have their own SS algorithms or tables. RSI PA is neither an algorithm nor a table. For each item-location, RSI PA simulates thousands of possible futures, iterating each until SS is the minimum that achieves TSL in the simulated SLC – without expediting. NOTE: In this article, “safety stock” is synonymous with “buffer inventory.”

2. Reorder point – This example uses ROP inventory-replenishment method. SS is a component of reorder point. RSI PA’s enhanced reorder point quantities reflect the enhanced SS in Point 1 above.

3. Expected average quantity on hand (AQOH) – SS is also a component of AQOH. PA’s enhanced SS materially affects AQOH.
Predictive analytics improves income statement and balance sheet
RSI PA’s enhanced item-and-location SS, reorder point and AQOH also affect various inventory costs (e.g., inventory-carrying and expediting costs) and average monetized inventory on hand. These influence profitability (e.g., gross profit), inventory velocity (e.g., annual turns) and cash flow. RSI PA’s enhanced SS cascades to a series of financial improvements. Here is the previous MEIO example financial performance – after RSI PA’s enhanced SS and reorder point levels:

Now, the same financial summary as RSI PA-to-MEIO monetized and percentage differences. Note that RSI PA materially improved both profitability and inventory velocity:

Example financial values improved by RSI PA
Cost of goods sold reduced by $27K from decreased inventory carrying costs due to RSI PA’s overall SS reduction. (The COGS in this example includes unit base cost, reordering costs and inventory holding costs.)
Gross profit increased by $27K, raising gross margin from 35.5% to 35.7%.
Average inventory on hand decreased by $610K, nearly a 31% reduction – adding 3.1 annual turns and reducing days on hand by more than 15 days.
Make predictive analytics enhancements happen
What would it take to make these what-if financial improvements a reality? No brick and mortar. No supplier negotiations. No logistics changes. Instead, in the existing planning system’s item master for each item in each location, simply change MEIO’s first-pass reorder point (or safety stock, min and max, PAR value, kanban parameters, days of supply, …) to RSI PA’s enhanced recommendation. A quick PA export and item-master upload make it happen.

Conclusion
MEIO is valuable for designing complex supply-chain networks. It’s what-if capability can support proposed network improvements and help optimize, for example, end-to-end supply-chain paths to reduce inventory costs and/or improve EOQs. Right Sized Inventory PA doesn’t compete with nor replace MEIO. Quite to the contrary, the RSI PA model is laser-focused on ideal combination, optimizing each item-location’s one or two replenishment inventory-policy parameters.
Appendix A
Example MEIO Inputs and Calculations
Note: For the sake of illustration, this example MEIO has approximately 10 inputs representing an item-location supply-chain’s demand, lead time, reorders and costs. Commercially available MEIO solutions may have dozens of inputs for supply-chain costs and other parameters.
Historical demand data:

Historical lead time (replenishment) data:

Replenishment review intervals and service level targets:

Replenishment reorders and related costs:

Inventory holding percentages and costs:

Unit costs and related reorder and holding costs:

Calculated safety stock quantity, EOQ, reorder point:

Calculated effective reorder quantity, average quantity on hand:
